
Island data

SIDS
Data Lab

Four datasets, built from years of RESI research, on the forces that shape island futures: climate loss and damage, resilience finance, multidimensional poverty and debt. No technical background required. If you can ask a question about small island states, the lab can help you answer it.

Welcome to the RESI data lab

The Lab Four datasets · one place

Small Island Developing States are among the most discussed and least understood countries in the international system. Their realities are often reduced to a single storyline. The data tells a fuller one.

The Data Lab brings RESI's core datasets on SIDS into one interactive space. Four datasets, built from years of research, covering the forces that shape island futures: climate loss and damage, resilience finance, poverty and debt.

No technical background required. If you can ask a question about small island states, the Lab can help you answer it.

Open the data lab

The lab, running.
39 small island developing states, and the ocean they govern Land is a fraction of it. The exclusive economic zones are drawn here because they are the scale most island policy is actually written at.

01

Resilience Finance

The flow of international development finance supporting climate resilience in SIDS. Understand who is providing funding, where investments are directed and how support aligns with countries' vulnerability and resilience needs. Drawn primarily from official development assistance targeted at climate resilience.

In the lab Finance by country, by provider, by sector on the OECD CRS classification, by financial instrument, and how concessional the money is.

Go to Finance

$23.5B

Total, to SIDS

all objectives, 2013–2023

$15.6B

Of it, for adaptation

2013–2023

$36.46

Per person across SIDS

annual average

0.60%

As a share of SIDS GDP

2013–2023
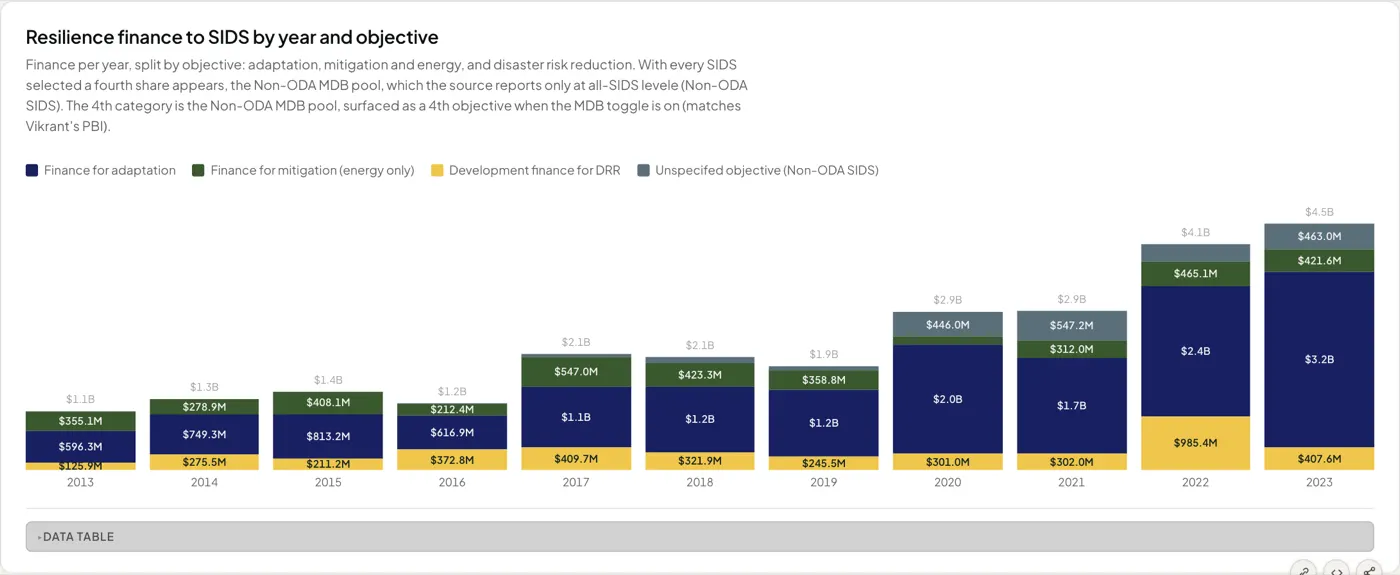
The Resilience Finance dashboard in the RESI data lab
Resilience finance to SIDS by year and objective

02

Loss and Damage

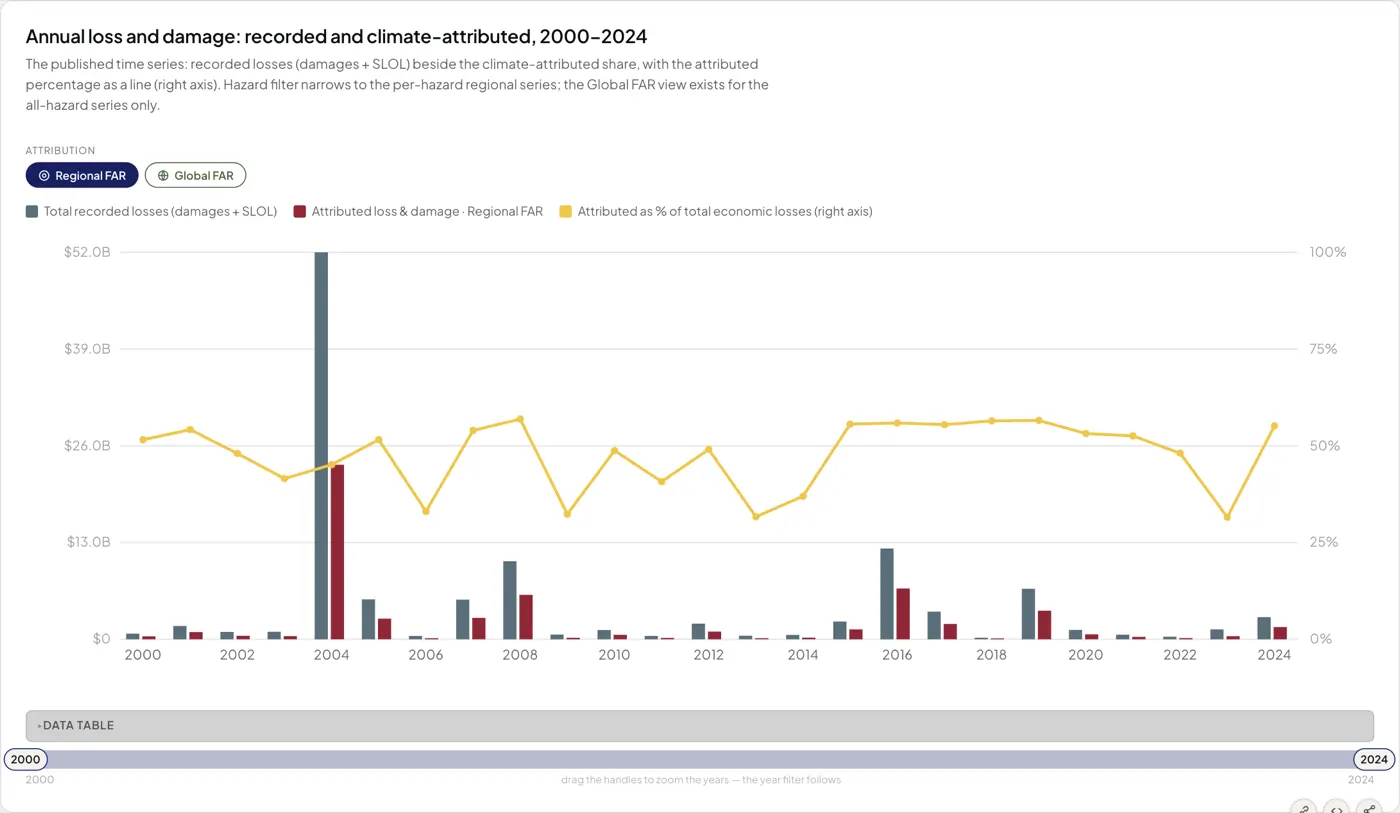
The human and economic impacts of climate-related disasters across SIDS. See how much of total loss and damage can be attributed to climate change, how losses have evolved over time and where the greatest impacts are being felt.

In the lab Cumulative loss and damage country by country, people and money broken out by hazard, the insured and uninsured shares, and projections to 2050 under 1.5 °C and 2.0 °C.

Go to Loss and Damage

$115.4B

Total recorded

damages and slow-onset loss, 2000–2024

$57.2B

Attributed to climate change

regional attribution, 2000–2024

10,302

Deaths recorded

2000–2024

53.7M

People affected

2000–2024

The Loss and Damage dashboard in the RESI data lab
Annual loss and damage: recorded and climate-attributed, 2000–2024

03

Debt in SIDS

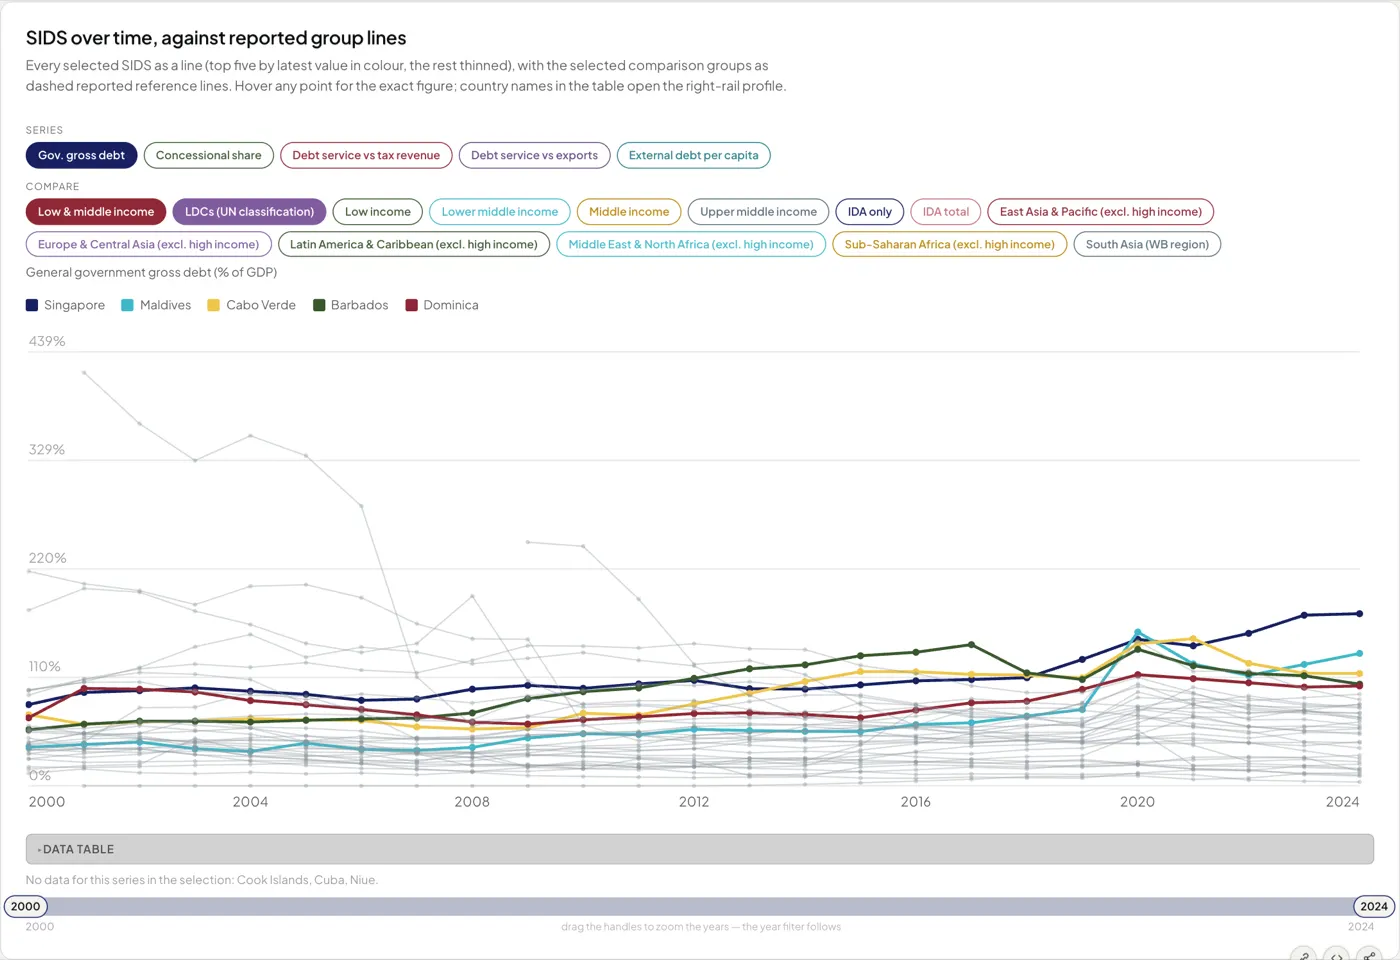
A snapshot of the debt burdens and fiscal pressures facing small island states, and how debt dynamics shape governments' ability to invest in development, climate resilience and long-term growth.

In the lab Five debt-sustainability series, every SIDS tracked against reported group lines, and the full ranking on whichever series you choose.

Go to Debt

174.3%

Highest government gross debt

share of GDP in 2024, Singapore

3.9%

Lowest government gross debt

share of GDP in 2024, Tuvalu

36

SIDS reporting in 2024

of the 39 in the dataset

5

Debt series

World Bank and IMF, 2000–2024

The Debt in SIDS dashboard in the RESI data lab
Where SIDS stand on the selected series

04

Multidimensional Poverty

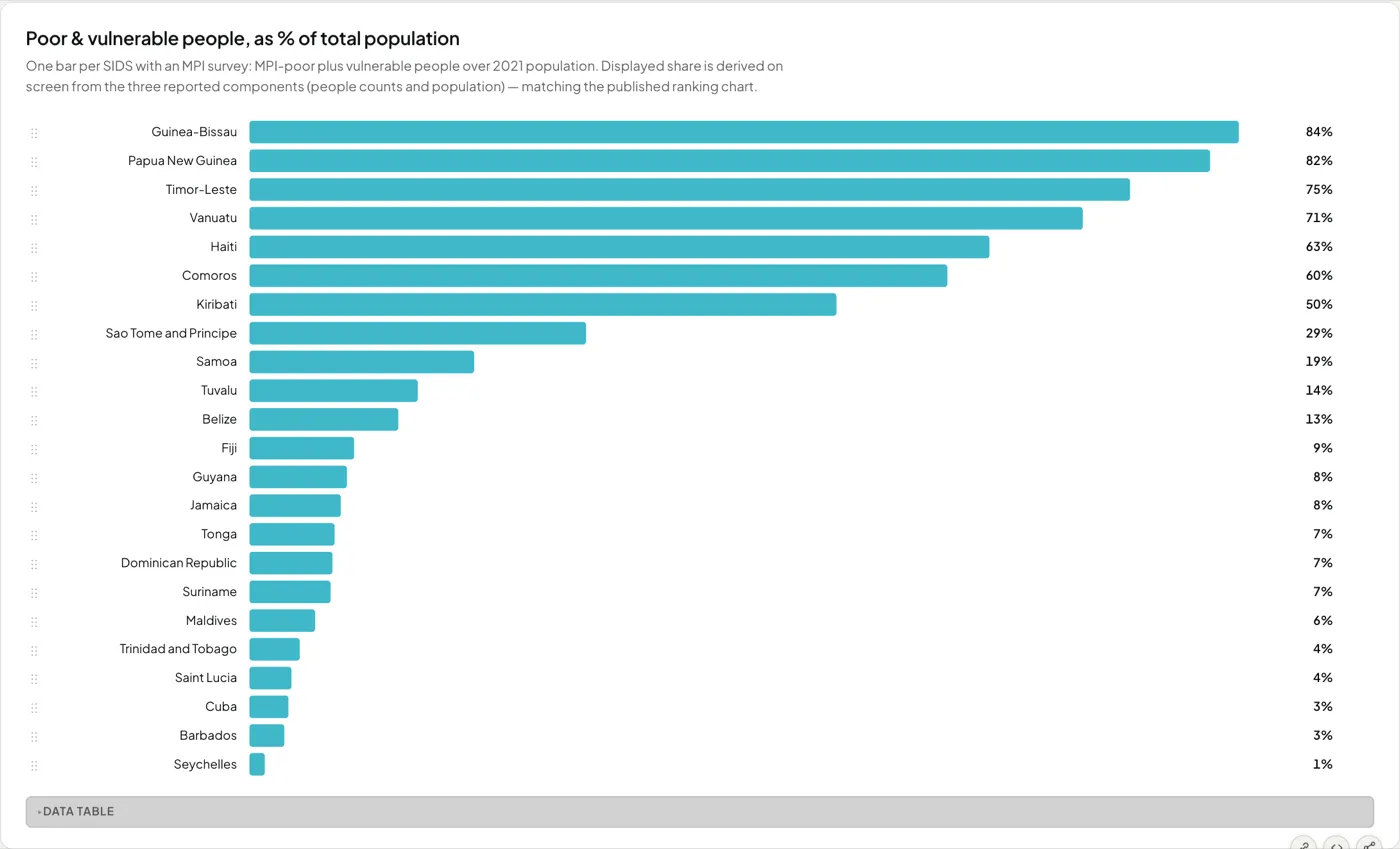
Poverty across SIDS, measured beyond income. This dataset captures the broader dimensions of deprivation and vulnerability, and explores how poverty outcomes relate to the development finance meant to reduce them.

In the lab What deprivation is actually made of across health, education and standard of living, SIDS set beside other regions and income bands, the poverty shocks that follow real disasters, and who receives poverty-eradication finance.

Go to Poverty

13.3M

MPI-poor people in SIDS

reported SIDS aggregate

20.7M

Poor and vulnerable

the two counted together

36.3%

Share of the surveyed population

across the SIDS with surveys

7.4M

Vulnerable, not yet poor

reported SIDS aggregate

The Multidimensional Poverty dashboard in the RESI data lab
Poor and vulnerable people, as a share of total population

How to use the lab

Move through the data your way. Start with the question that matters to you: who is being hit hardest, where the money is going, what poverty looks like beyond income, or how debt constrains what islands can build.

Each dataset stands on its own. Together, they show how climate, finance, poverty and debt interact, and why no single number explains a small island state.

Why we built it

RESI has spent years working alongside SIDS governments and their partners. One challenge comes up everywhere: the evidence on small island states is scattered, inconsistent or locked in reports few people read.

The Data Lab is our answer. It puts the numbers where decisions get made: in the open.

The bigger picture

The Lab is part of RESI's wider work to improve the conditions under which SIDS can achieve financial sustainability, environmental justice, international alliances and equitable societies. The data is the starting point. The work it informs is the goal.

Open the data lab